Categories
#BecauseMath Economics Taxation Unemployment

Will low corporate taxes bring the jobs back?

Many promises have been made that any number of conservative policies will bring jobs back to America. In this post, we’ll examine the claim that lower corporate taxes will reduce offshoring of jobs by presenting a simple example.

Imagine a multinational company, Big Widget Inc. (BWI), can make widgets either in the United States or in Mexico. In Mexico, where environmental regulations are gentler and wages lower, BWI can make widgets for $90. In the United States, they can make widgets for $95. No matter where they manufacture them, they can sell widgets for $100 in the United States.

Now, in this fictional world, let’s imagine the corporate tax rate is the same 40% in both countries. How much tax will BWI pay and to whom? Answering this requires a short primer on transfer pricing. When a company does business in 2 countries, it has a separate affiliate organization in each country. When goods manufactured by BWI Mexico are imported by BWI America, BWI assigns a “price” for those goods as if BWI Mexico sold those goods to BWI America. The price is called the transfer price. Ideally, this price will match the price that two unaffiliated companies would agree on. The terminology here is “arms length.” The tax authority in each country tries to prevent companies from gaming the transfer price, but there’s some wiggle room here.

If the two countries have the same tax rate, then BWI doesn’t care what the transfer price is. But, the two countries do. If the transfer price is $90, then BWI Mexico recognizes zero profit in Mexico and the USA collects all the taxes. If the transfer price is $100, then BWI Mexico recognizes all of the profit and Mexico collects all the taxes. In either case, BWI pays 40% of it’s $10 profit, or $4.

But Republicans tell us that reducing that corporate tax rate will bring that manufacturing back to the USA. Let’s explore that.

Imagine America cut its corporate income tax to 10% while Mexico holds its tax rate at 40%. In this scenario, BWI wants to minimize the transfer price for widgets. If the transfer price is $90, BWI can recognize the whole $10 profit in the USA and pay just $1 (10%) on its US profit. That’s a nice windfall for BWI but a big loss in tax revenue for Mexico. Mexico will probably insist on a higher transfer price. Maybe $95. At that transfer price and those tax rates, would widget manufacturing return to America?

By importing widgets at a $95 transfer price, BWI can make a $5 profit in each country. Mexico charges a 40% tax on the $5 attributed to BMI Mexico and the US charges 10% on the profit attributed to BWI America, so BWI Mexico pays $2 in taxes (40% x $5), BWI America pays $0.50 and BWI keeps a $7.50 after tax profit. That’s certainly better than the $6 after tax profit before the rate cut. But will BWI be motivated to move manufacturing to the US? In America, they can manufacture widgets for $95 and sell them for $100 and make a $4 after tax profit. BWI will still import since $7.50 beats $4. In fact, even at a transfer price of $100, which forces all profit on imported widgets to be taxed at the high Mexican rate, BWI *still* makes higher after tax profit by importing. The transfer price has to be over $105 (forcing the BMI America to sell at a loss!) before manufacturing in the US generates higher profits (Try it!).

I, myself, don’t see much reason to believe lowering the tax rate will boost American manufacturing. But, there’s another effect of this strategy that’s even more distressing. The policy fight over the transfer price rearranges some political alliances. We can see this by examining the desires of each of several parties–the US government, the Mexican government, US manufacturers and US workers. Two parties have an interest in a low transfer price. The US government wants a low transfer price so that profit is recognized in the US and can be taxed there. Manufacturing firms also want a low transfer price since they can pay less tax overall by moving profits to the low-tax US.

There are two parties in favor of high transfer prices, too. The Mexican government wants a high transfer price to keep taxable profits in Mexico. The other party interested in a high transfer price is American workers. It was only a very high transfer price that made manufacturing in the US more attractive. So, US workers and their unions will push to keep the transfer price high in order to move manufacturing from Mexico to the US. The sudden drop in the US corporate tax rate aligns US corporations and the US government in opposition to the Mexican government and US workers. The reader is left to decide for themselves who they think will win this political fight–the combined forces of multinational firms and US legislators or the Mexican government and American workers. But you can probably guess what I would predict.

This gaming of the corporate tax rate has two sets of winners, both of them powerful. But none of them are you and me.

Categories
#BecauseMath Economics Unemployment

A non-economist examines the minimum wage

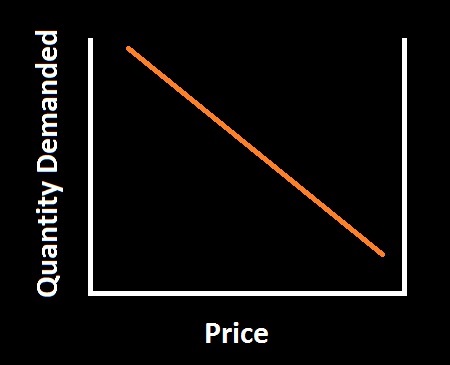
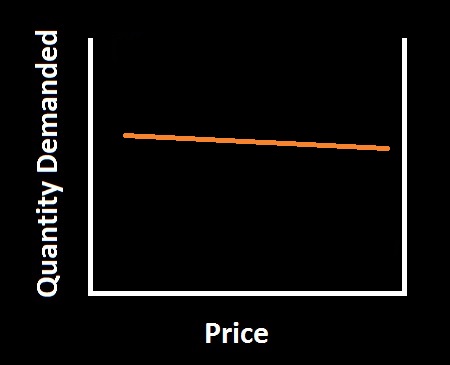
There are no economists at ThisWeekInStupid. But, that’s not going to stop us from weighing in any more than it stops economic ignoramuses like Paul Ryan, Bernie Sanders or Peter Schiff. Recently, we penned a piece opposing a minimum wage hike, or at least suggesting that there were plenty of other ways to help minimum wage workers that were less apt to cause unemployment. Today, we’re going to go back on that a little. The main argument against a minimum wage involves, naturally, a supply and demand plot, like this one.

MinWagePlot0

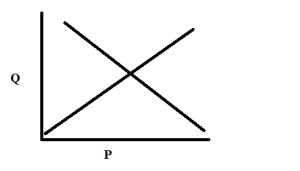
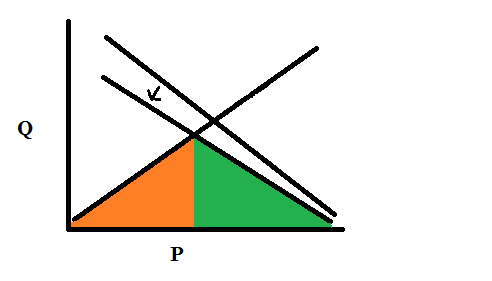
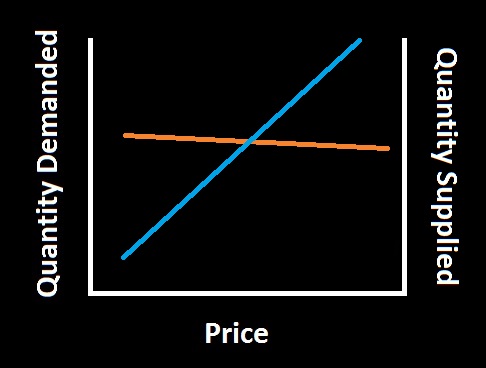
The downward sloping curve is the demand for workers. These are the employers who hire fewer workers when the wage is high. Many businesses can make money hiring workers for $4/hour. Fewer businesses can operate profitably paying $15/hour and very few can survive if they must pay $25/hour. The other curve, which slopes upward, is the supply curve. These are the workers. For $4/hour, lots of people will go back to school or live on their spouses income or live in their parents’ basement rather than work. For $15/hour many more will be willing to work. And for $25/hour, workers will come out of the woodwork. They’ll get childcare, come out of retirement, rearrange their class schedule, etc. (Note that this curve assumes all workers are equal, which is nonsense, but it may be illustrative anyway.) Where these two curves meet is the equilibrium wage. That’s where wages will naturally fall without any government interference. This next graph is decorated a little more.

MinWagePlot1

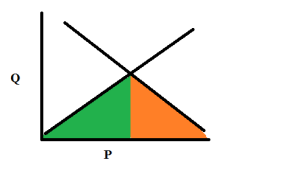
In this graph, I’ve colored two regions underneath the curves. The green region represents the producers surplus–extra profit for workers. That is, there are some workers which would have been willing to work for $4/hour. They consider their hour to be worth $4. If the equilibrium wage is $6/hour, then they are $2 richer for every hour they work.

The orange area is the consumer surplus–extra profit for employers. Some employers could break even by paying workers $8/hour. If they only pay $6/hour, the employer is wealthier by $2 for every hour worked. These two areas are what make capitalism fun. Voluntary exchanges make both parties wealthier. Always. So is it ever a good idea for government to interfere with voluntary exchange? Let’s see.

The effects of a minimum wage

When a minimum wage is introduced above the equilibrium wage, a few things change. The first result is unemployment. In our curve, the equilibrium wage might be $6/hour. With a minimum wage set at $8/hour, two things happen. First, more people are seeking work. Second, fewer businesses are willing to hire. Both of these effects cause unemployment (but only the second of these effects represents a change in employment from the equilibrium situation). It’s represented by U in the plot below.

MinWagePlot2

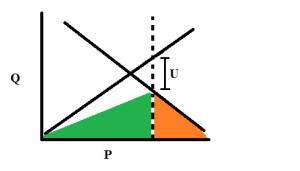
At the new wage, employers are demanding fewer workers than the total workers seeking a job. Liberals should stop denying this effect. It’s true that there are studies that found that in a subset of businesses hiring minimum wage workers, the effect on employment was weak or absent. But these studies and others also point to a stimulative effect of a minimum wage wherein wealth is transferred to poorer workers who tend to immediately spend their money. This tends to boost demand. So the question is, if there’s a boost in demand, why does employment stay the same? Why doesn’t it increase? A natural explanation is the argument above. The first order effect is the one we see on the supply and demand curve pushing employment down. The stimulative effect helps to mitigate that effect. Also, there are many careful studies which reach the conclusion that a minimum wage does decrease employment.

Returning to the supply/demand plot, let’s look at what’s happened to the green and orange regions. The wage is higher, so the green region would be the area under the supply curve up to the new minimum wage. Except that there is unemployment. Only a fraction of the workers desiring employment can find jobs. So we should reduce the green region by the unemployment. An approximation of that is the green shaded region above.

The orange region is more straightforward. Those employers who could not profit by hiring workers at the minimum wage, stopped hiring. So the orange region is the area under the demand curve above the minimum wage.

So, are the workers, collectively, better off? Certainly those workers who keep their jobs are better off. Our worker who was willing to work for $4/hour is now making $8/hour and gaining wealth at $4 for every hour worked (up from $2 before the minimum wage). But, some other workers, including some willing to work for $4/hour, have lost the chance to work. In many cases, this represents an overall gain for the workers as a whole. It’s easy to see how the new green region could be larger than the old especially if the demand is quite inelastic–that is, if demand for workers stays largely the same as wages increase. But when this is the case, it’s important to ask, where did this extra money come from?

Partly, it comes out of the profits formerly collected by the employers. In our new curve, the orange region is clearly smaller. Employers of minimum wage workers will almost always argue against a minimum wage. The first order effect is to shrink their profits.

Another source of increased wages for workers is increased prices for the end goods. Conservatives often say dumb things like, “Employers just pass the additional costs on to consumers.” This is lazy economics (just ask a non-economist!). There’s a separate supply/demand curve for whatever good or service the employer is selling. Presumably, this curve is what set the consumer price of the end good in the first place. Unless the minimum wage changes the market for end goods, the pricing strategy of the employer is unlikely to change much. Of course, the supply curve for the end goods may change as competitors with smaller profit margins who cannot afford the new higher wage, drop out of the market. This may cause prices to rise, but it will still be subject to the end consumer demand curve. Consumers will not blithely pay higher prices just because our employers’ costs rise. Research shows that something like one-third of the additional cost of a minimum wage hike is passed to consumers as higher consumer prices.

So, some of the extra worker profit comes out of employer profit and some comes from the end consumers. One important thing should be clear from the plots. The profit the workers gain from the minimum wage is always less than the profit the employers lose. That is, the first order effect of government interference is to reduce the overall wealth of the economy. This should have been obvious from the beginning. When a worker valuing his time at $4/hour works for an employer who values that same work at $10/hour, there is, in total $6/hour profit to be made and split between the employer and employee. Changing the wage shifts the allocation between the employer and employee, but does not affect that total. So the total possible surplus (consumer + producer) was fixed before the minimum wage was introduced. The minimum wage can only affect this total by prohibiting some of the exchanges, reducing the total profit.

So, isn’t a minimum wage just a terrible idea?

Redemption?

Not necessarily. Think of a minimum wage as a leaky pipeline that transfers wealth from wealthy employers to less wealthy workers. There are some good reasons to redistribute wealth downward. First, wealth exhibits a diminishing marginal utility. That is, each dollar improves the life of a poor person more than it does a rich person. To a poor person, $500 may mean repairing his only car or fixing his children’s teeth. Meanwhile, to a rich person, it may mean an additional Coach purse or a spectacular bottle of wine. Even though the total amount of stuff has not increased (and has, in fact, decreased) the utility of the stuff, or the happiness it produces, may increase.

The second reason to redistribute wealth applies only in a Keynesian recession. When an economy is in the doldrums due to deflation and weak demand, shifting wealth from rich to poor can boost the economy since poor people tend to spend their money more quickly and readily than rich people. This moves money through the economy faster and creates inflation. In an economy dogged by deflation due to a shrinking money supply and weak demand, this is a welcome effect. But, in an economy operating at full capacity or one experiencing supply-push inflation, this is a problem. More spending can cause inflation to run too high, distorting price signals. The great part about a fixed minimum wage is that inflation quickly makes the minimum wage irrelevant as wages are pushed above the mandated minimum. A minimum wage below the equilibrium wage is like having no minimum at all. So a mildly restrictive minimum wage is an automatic recession fighter providing stimulus when demand (and wages) fall without causing inflation when wages rise.

Rent-seeking

The final reason to redistribute wealth, especially through a minimum wage, comes from Henry George (whom modern economists ignore at their peril). George and his disciples point out that at least some of the profits employers collect are “economic rent” on the non-produced inputs to production. That is, the division between employer and employee may be partly because of something about the employer which does not make her more productive. Certain people may have better access to capital due to their birth or connections or physical characteristics or land ownership or habitus. Where these characteristics are unrelated to productivity, they amount to a contrived exclusivity, depressing the demand for workers and reducing wages. Marx would say that the separation of the workers from the means of production enables excessive profit-taking by employers. Of course, not all advantages of employers are rent taking. An employer who has labored to produce 10 shovels might reasonably hire 10 workers to use them, taking profit for providing the shovels. But, when that employer takes additional rent because she owns the land or because her father-in-law fronted her the money for the shovels or because she has an exclusive right to produce or use shovels, she’s collecting economic rent. Rent-taking reduces the efficiency of markets and destroys wealth in the same way a minimum wage does but to the disadvantage of workers. A minimum wage forbids any exchange of labor for money below a certain wage. Rent requirements forbid or discourage businesses started by otherwise productive people without the right characteristics or connections.

A brief clarification is probably a good idea here. In economic terms “rent” is not only the money you pay your landlord to continue to live in your apartment (although that’s one example). It’s also the benefit you get from being white or being the boss’s nephew or even for holding the patent on a product. Not all assets on which you collect rent are nefarious or unfair. But what makes it rent-taking is that you benefit for some other reason than that you’re more productive.

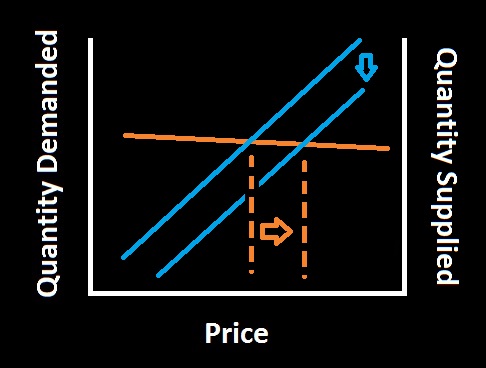
Let’s look at our supply and demand curves again. Rent requirements artificially reduce the number of potential employers. For simplicity, we represent this as a simple multiplicative reduction in the labor demand. Suppose that our rent requirement means that 15% of potential employers are pushed out of the market.

MinWagePlot3

In the curve above, it’s clear that the downward shift in demand reduces the wage and increases the profits for the remaining employers. At the same time, the employment shrinks. The effect is, in fact, quite similar to the effect of a minimum wage with the increased profits for employers coming partly from decreased profits for workers.

In cases where there are rent requirements for new businesses, a minimum wage may boost wages which were artificially suppressed by rent-seekers. But, a minimum wage is a very blunt instrument. It harms both rent-seekers and naturally profitable businesses. In this curve, we can see that the combination of a minimum wage and rent requirements is better for workers than no minimum wage (or might be), but still much inferior to eliminating both the minimum wage and rent requirements.

MinWagePlot4

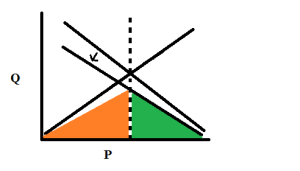
Here, the minimum wage has pushed the price back out to the equilibrium price, but it cannot undo the effect of the rent requirements. An economy is much better served by finding ways to reduce rent-seeking, especially since both the minimum wage and the rent requirements drive up consumer prices. But, in markets dominated by rent requirements, a reasonable minimum wage may do more good than harm.


Categories
#BecauseMath Elections Obama

Is Voter Fraud a Good Investment?

Today, we’re indulging a conservative fantasy. Let’s examine what it would take to swing the 2012 election with fraudulent votes. The vote in Florida came down to 78,000 votes–a fairly narrow margin. If I were the Obama campaign looking to steal the election, that’s the easiest state to flip. Now, the problem is that penalties for voter fraud are severe–3 1/2 years in jail and a $10,000 fine. But, depending on how I do it, it can be hard to detect. The best way might be to find people who are dead or moved away, but not removed from voter roles, then impersonate them. It wouldn’t be reasonable to get away with it all 78,000 times. You should probably pad that by at least 20%. Let’s say you make 100,000 attempts.

Now, imagine you could find people willing to do this 100,000 times and could identify the correct names. It could be the same person several times, but not several thousand times. Probably, you need 10,000 people. Easy enough to find 10,000 true believers to each make 10 attempts.

With 100,000 attempts, you’d be wise to assume some of these will be not only thwarted, but reported to the elections commission.

If you catch 1 in 100 at $10k/count that’s $7.8M, or 84% of all Obama campaign spending in Florida. So, if you’re going to use voter fraud to flip an election, you’d better have legions of people willing to go to jail for you and either a mound of cash or a willingness to cancel all your ad buys, signage and get-out-the-vote efforts and go whole hog for voter fraud! Good luck!

Categories
#BecauseMath Economics

Spontaneous order is always awesome

As I take aim at Friedrich Hayek, on a site called thisweekinstupid, I do it with some trepidation. Hayek was a well-spoken, skilled and innovative economist. That doesn’t mean he didn’t occasionally get it wrong. And in the unfortunate case I’ll discuss today, Hayek is found contributing to a potent and damaging piece of stupid that characterized much of the late 20th century–the cult of the invisible hand.

Beauty and power, spontaneously

Pros and cons of spontaneous order

In the 1950s natural sciences like physics and especially biology began to notice that large systems made from simple parts could work together to create surprising and miraculous results. The brain is the most exciting example of this. Although some neurologists will likely disagree, the dynamics of a single neuron are simple. On receiving a pulse of energy from a nearby neuron through its dendrites, it sends a pulse to other neurons through its axon. This pulse is then received by the dendrites of other neurons. No one would look at that simple system and guess that a collection of those interactions would produce human thought. That miracle of complex macrodynamics from a multiplicity of simple microsystems is what Hayek called “spontaneous order.” Hayek and others believed fervently in the power of spontaneous order to improve people’s lives. Hayek called it a “fatal conceit” to imagine that a designed system could match a spontaneously ordered system for efficiency.

During the Goldwater/Reagan revolution, this became the justification for opposing government economic interference in almost any form. Any top-down tweaking by government moves the economy away from the spontaneous order, which is assumed to be the most efficient possible. It was also a convenient defense against the primary ideological foe of the United States–the Soviet Union. To those of the Austrian school, the economic failure of the Soviet Union was definitive proof of Hayek’s idea.

But on closer examination, the assumption that spontaneous order is always elegant or beneficial seems to come from nowhere, and certainly not from any of the natural sciences. As we look at other examples, we find spontaneous order is, indeed, powerful. But sometimes spontaneous order can be fatal. A herd of cattle can be thought of as a complex system made of simple parts. We could describe the behavior of cows quite simply: Move toward grass; avoid obstacles. But, spurred by the wrong external stimulus, those simple dynamics can cause a stampede as one cow starts to run enticing others to run to get out of its way. Here, the order that arises spontaneously is certainly unexpected in that it does not follow in a straightforward way from the micro behavior. In this, a herd of cattle is like a snowflake or a brain or an ecosystem. But in the case of cows, the macro behavior is not beneficial. Although the microdynamics were about avoiding injury, the resulting stampede can cause cattle to be trampled and killed.

Spontaneously ordered transportation

So, which kind of spontaneous order is our modern economy? Here’s modern-day libertarian John Stossel extolling spontaneous order and its wisdom in leading America away from transportation by train in favor of cars.

At last month’s State of the Union, President Obama said America needs more passenger trains. How does he know? For years, politicians promised that more of us will want to commute by train, but it doesn’t happen. People like their cars. Some subsidized trains cost so much per commuter that it would be cheaper to buy them taxi rides.

The grand schemes of the politicians fail and fail again.

By contrast, the private sector, despite harassment from government, gives us better stuff for less money—without central planning. It’s called a spontaneous order.

Cars may be the right answer for many communities, but transportation innovations can be a very clear example of the failure of spontaneous order. That is to say, the order arises, it’s just not helpful. Examine the problem of electric cars. My conservative friends have posted pictures to Twitter and Facebook of four or five completely unused car charging stations, usually at government buildings. “Typical government waste,” they’ll say.

Thanks, Obama!
Thanks, Obama!

They think the market has spoken, and maybe it has. But the other side of the story is that the least convenient aspect of owning an electric car is finding a place to charge it. This certainly reduces the number of electric cars on the road. When a car buyer (one simple part in our complex system) is shopping, she, hypothetically, considers an electric, but since there are no charging stations where she works, she decides on internal combustion. Meanwhile, someone at her work proposes installing charging stations in the parking lot. They take a stroll through the parking lot and find that very few employees own electric cars. So they decide against the charging stations. And around and around we go. More electric cars and more charging stations might be the optimal solution, but the individual actors, pursuing their own interest, can’t get there. Certainly the company can take a chance and build the charging stations hoping more employees are enabled to buy the electric cars they want, but that risk undeniably reduces the chance of us getting there.

For some other examples of the inefficiencies of spontaneously ordered system, check out my post on public goods.

Lessons from simulation science

In simulating complex systems, we call this a local minimum. Very often a complex system can find itself in a configuration that is not the global best configuration, but from which any small change looks worse. This is a local minimum. When considering electric cars, the status quo (no electric cars and no charging stations) is better than either a) some electric cars with no charging stations or b) no electric cars and some charging stations. So each individual player sees it in their interest to stay right where they are.

Consider this ball rolling on an odd-shaped surface.

The lowest potential energy configuration for the ball–the place it “wants” to be–is at the bottom of the valley marked 3, but in some places on the curve, point 2 for example, the ball sees a hill on either side. It’s in a “stable equilibrium.” If I want to move the ball to the true lowest energy state, it needs a push up the hill. It needs to be moved toward higher energy in order to find a better state.

Our electric car economy is the same (or might be). The economy of transportation is sitting at point 2. Everyone’s myopic view tells them unilateral action is wasteful. Charging stations installed at libraries and government buildings are an attempt to push us up the hill to see if we’ll fall into a better global minimum. It looks like “typical government waste” because we’re not looking at the whole curve. All we see is the hill in from of us. It might work or it might not. Only a global view could hope to predict. But only a fool concludes that the order found organically is always best. In game theory, this kind of stable, non-optimal state is called a Nash equilibrium after John Forbes Nash, Jr. profiled in A Beautiful Mind.

Simulating large systems is what I do for a living. Hayek didn’t have the benefit of huge supercomputers to predict what complex systems will do, but from my experience, assembling a system of millions of interacting parts, turning it on and expecting it to organize itself into an optimal configuration in a reasonable time without any help from me is insanity. When we want to optimize complex systems like static fluid flows or magnetic materials, we have to nudge them to pop them out of local minima or steer them speedily through what would otherwise be a slow spiral toward optimality. We try solving pieces of the problem independently, then stitching them together. Sometimes we reset things to an alternate starting configuration and see if that leads to a better place. (The economic implications of that should keep wealthy capitalists up nights). From where I sit, to expect something as complex as a national economy to optimize its resources without any help demonstrates profound ignorance of the dynamics of complex systems.

We should neither discount the power of spontaneous order, nor place unwarranted faith in it. That’d be stupid.

Categories
#BecauseMath Appendix Economics Taxation

Appendix: Public Goods

Our discussion of public goods seemed incomplete without at least a little math to back it up. But no one wants to alienate the mathophobes, so we parked this tidbit in the “appendix.”

Let’s analyze a few public goods. Imagine, again, 5 farmers. Last year, one farmer contracted with a beekeeper to manage a hive of bees near his field. He paid $2500 for the year. The next year, his harvest increased by $4500. A farmer in a nearby neighborhood paid for even more hives and boosted his profits even more, although the first $2500 is the most effective in this regard.

But he’s not the only one who benefits. Each of this neighbors also increased their crop yields. After doing some research, he discovers that, in a community such as theirs, for each of your neighbors hiring a $2500 bee hive, you can get $1500 more crop even without spending a cent on your own bees. Mathematically, let’s conjecture that the value of the increased yield is

[latex]\sqrt{\alpha S_0 + \sum \beta S_i}[/latex]

and the profit from that extra spending is

[latex]\mbox{Profit}= \sqrt{\alpha S_0 + \sum \beta S_i} – S_0[/latex]

where $latex S_0$ is the amount I spend on bees and $latex S_i$ are my neighbors’ spending. The constant (exogenous) parameters $latex \alpha$ and $latex \beta$ control just how much benefit I get from my own and from my neighbors’ spending, respectively. The reason for the square root is the idea of “diminishing marginal utility.” Spending $6000 on bees is still better than spending $3000, but something less than twice as good. Your first dollar is more important than any subsequent dollar. That said, the utility curve does not have to be a square root.

Now, if all of the neighbors are equally interested in their property values, they might agree to all spend the same on bees, perhaps in a written agreement. If we constrain all of $latex S_i$ to be the same value, we have a formula of just one variable and can plot the profit function:

Profit is highest when everyone spends $30.

From the plot, we can see that, if the neighbors all cooperate, they can each get $6000 more crop from spending just $3000 on bees. This is the most efficient level of spending. But here we run into the free rider problem. Suppose the neighbors do not cooperate and one of the neighbors does the calculation without considering anyone else. If everyone else continues spending $3000, how much should I spend to maximize my profit? When we fix $latex S_i$ at $3000 and allow just $latex S_0$ to vary, the new plot looks like this:

Nice guys finish last

The neighbors cooperating can make a $3000 profit, but from the blue curve we  see that the selfish neighbor can spend just $500 on bees and make a $3500 profit. In this situation, the self-interest of the individual hinders the prosperity of the community.

The situation gets even worse for goods which are more public. Perhaps the road leading between the town and the farms needs fixing and they’re freestaters, so the government won’t do it. They’re on their own. This fix will reduce wear on the trucks that take crops to the markets, etc.. Mathematically, $latex \alpha = \beta$. In that case the plot looks like this:

paving

A free-rider, in this case, would have almost no incentive to contribute. That’s not exactly true since even the free riders understand they’re gaming the system and that others will be inclined to seek the same deal. When you incorporate this, you find that, in fact, neighbors are willing to spend just $200 on paving, leaving $3200 of profit on the table. (For more details on this aspect, check out the appendix to the appendix, Galt-ifying Public Goods.) The problem only gets worse as the community grows. If you’re paving a street that benefits 20 people with the same utility function, people are willing to contribute just $47 and will miss out on more than $20,000 profit.

Public goods are not always so easily quantified and it’s usually there that disagreements arise, but a little math goes a long way toward appreciating that opinions about public spending are a continuum and that pretending the market is always right (or always wrong) has real consequences.

Not enough math yet? Check out the appendix to the appendix, where we ask the mathematical question, how much more efficient would John Galt’s community (from the novel Atlas Shrugged) have to be to make up for refusing to subsidize public goods.

Categories
#BecauseMath Economics Health Care

The Market Will Set the Right Price for Health Care

I don’t suppose the interweb needs another discussion of the failings of market forces in health care markets. And yet the idea persists that setting the price of health care should be left to the unregulated market and that this will lead to maximum efficiency. The omnipotence of the market is a comforting concept.

Demand-side troubles

But the market for anti-retroviral drugs bears little resemblance to golf clubs or top sirloin. At risk of sounding condescending, a typical demand curve looks like this

LawOfDemand

As the price of a good or service rises, the quantity demanded shrinks. Lots of people will buy a pair of basketball shoes for $6. A few would pay $140.

But this doesn’t often work for medical services. I recently had my appendix removed. I’m told a typical appendectomy costs $25,000–a lot of money no matter who you are. But whether it had cost $100 or $100,000, I still would have bought exactly one appendectomy. The demand curve for appendectomies looks more like this:

Quantity demanded is unaffected by price

There is, perhaps, some fall in demand. A 96-year-old might decline a quarter million dollar appendectomy. In some cases, there may be more than one treatment for an ailment so that one good or service may be substituted for another. But, in general, demand for health care services, especially the very expensive, life-saving treatments, tends to be highly inelastic. The quantity demanded is affected very little by the price. So, can providers of health care charge whatever they like?

Supply-side salvation?

Not necessarily. There may be some help on the supply side of this market. But, one reason markets are so effective and robust is the interplay of supply and demand. Without both working properly, the market can misallocate. When the supply side of the equation breaks down, for example in the case of a monopoly, we know that even with a healthy demand side, we’ll run into inefficiencies. So, we already have cause to worry. A truly effective market needs both a healthy demand side and supply side.

Switching to the supply side of things, if the price of a good is very high, more people will be willing to supply it. A supplier that overcharges will find herself undercut by a competitor willing to supply the good at a lower price. So, even with highly inelastic demand curves, there’s an equilibrium price at the point where the supply and demand curves meet.

The market sets the price where the supply and deamnd curves meet.

So, it all might work out just fine, as long as actors can’t manipulate the supply curve. Unfortunately, two of the easiest ways to do that are both, of necessity, highly active in health care markets. The first is patents. A patent grants a single company the exclusive right to produce a product for a certain period. A supplier with a patent cannot be undercut by a cheaper competitor. When you are the only supplier of a lifesaving procedure, the market will not place any limit on the price (although public opinion or your own morality might). For this reason, it’s more useful to think about the supply curve for health care research than for particular treatments. If the payout for developing a new drug is very high, more people will be willing to do research toward that end. So, even where patents are applied, there is a functioning supply side curve at work. But in such a market, price signals can take longer to move through the market. When I need medication today, it’s slim comfort to know that the exorbitant price I pay for patent-protected drugs is providing the impetus for a robust market for drug research.

Another common way to move a supply curve is through licensing. Most people who treat you in the hospital are licensed, some of them very licensed, which is wonderful. It comforts me immensely that the person holding the scalpel has undergone years of training and scrutiny. But, the effect of this is to reduce the supply of doctors, nurses and other medical professionals. The FDA’s approval processes provide the same type of scrutiny for medications, equipment and treatments, with the same effect.

I wouldn’t have it any other way, of course, but the effect of this licensing is to shift the supply curve downward, increasing the price of goods. The further the supply is reduced, the higher the price. The inelasticity of the demand curve (and also the supply curve) multiplies this effect.

As the supply is reduced, the price increases.

You can see how influence of these licensing processes could be very lucrative for suppliers. Doctors, for the most part, do important work for sincerely good reasons, but putting the AMA in charge of licensing doctors is a lot like asking the fox to guard the hen house. The tendency of almost everyone is to highly value their own work and the incentive for doctors is to limit the supply of doctors, raising their own salaries. Similarly, if pharmaceutical or medical supply companies can delay or scuttle approval for competing drugs and equipment, they also stand to make lots of money.

I’m not for a minute suggesting we do away with licensing of doctors or patents for drugs. Health care markets can’t be effective without these things. But, perhaps it’s a good idea to think hard about the markets for health care rather than blithely assuming the miraculous market will allocate everything just right. Without some advocates for consumers of health care, rising, inelastic demand will push prices out of reach and make life-saving care an unaffordable luxury.